SMT + CVD (NQ vs ES) w/ AlertsSMT + CVD (NQ vs ES) w/ Alerts
This tool combines Smart Money Technique (SMT) and Cumulative Volume Delta (CVD) to highlight high-probability inflection points on NQ (primary) versus ES (secondary).
How it works
SMT condition: the primary breaks its most recent swing (High for bearish / Low for bullish) while the secondary does not break the corresponding swing within a small retest window.
CVD confirmation: at the same time, the primary’s CVD shows divergence (higher price but lower/equal CVD for shorts, lower price but higher/equal CVD for longs).
When both align, the script plots a marker/label and draws a line from the primary swing to the signal bar. Alerts are fired.
Signals & Alerts
Labels: “SMT+CVD DOWN/UP” on the signal bar.
Lines: connects the primary swing → signal bar so you can see the structure that produced the signal.
Alert names: “SMT+CVD Bearish” and “SMT+CVD Bullish.”
Inputs
Primary / Secondary symbols: defaults NQ & ES (you can change them).
Resolution: use chart timeframe or specify one.
Swing Left/Right Bars: pivot detection depth (higher = larger swings).
Break Window Bars: how many bars the secondary has to not break for SMT to be valid.
CVD Up/Down By: Close vs Previous Close (default) or Close vs Open.
Anchor CVD Daily: resets CVD at session/day start.
CVD Smoothing (EMA): smooths the CVD line (optional show).
FAST Pivots (no future bars): left-only swing detection so signals appear sooner and behave well in Replay/live.
Require Secondary Pivot: if ON, SMT checks wait for a confirmed secondary swing; if OFF, signals can appear while the secondary swing is still forming (useful for Replay/testing).
Show CVD line: optional, may compress price scale.
Non-repaint notes
With FAST Pivots ON, swings are detected with no future bars (minimal latency = leftBars).
With FAST Pivots OFF, standard pivots require rightBars future bars to confirm the swing (classic, but naturally delayed).
Tips
For intraday futures, keep leftBars/rightBars small (e.g., 3/3) and Break Window 1–3.
In Replay, enable FAST Pivots and consider disabling Require Secondary Pivot if you want signals to appear as soon as the primary breaks.
Combine with session filters, execution rules, or liquidity zones for context.
Search in scripts for "Up down"

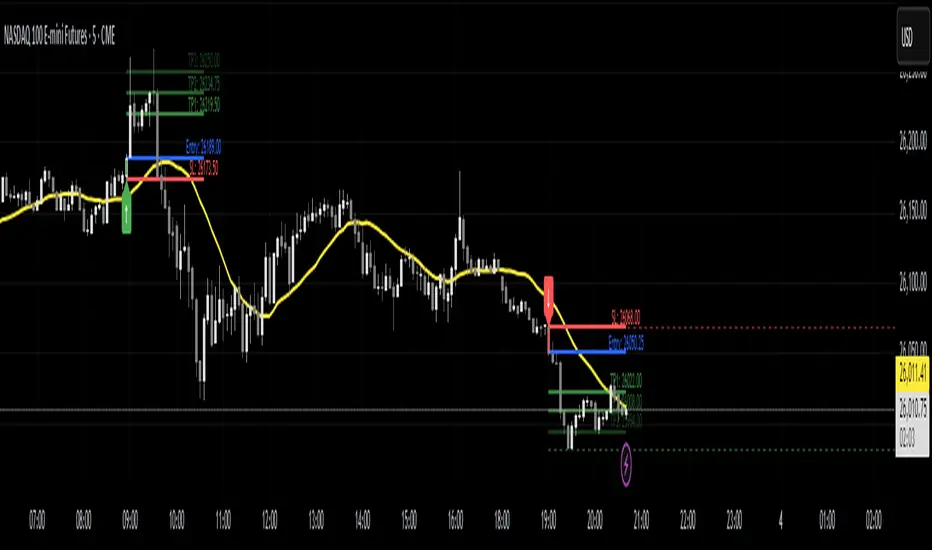
Power Bar [MMT]Identify and trade powerful market thrusts with precision. Power Bar detects high-momentum bullish and bearish candles that break recent support or resistance, combine proximity to a key moving average, and offer automated multi-TP trade management.
Features
Power Bar Detection : Spots large-bodied candles (relative to ATR) with minimal opposing wicks, originating near the 20 SMA, and breaking key support/resistance zones.
Fully Configurable : Adjust ATR length/multiplier, wick size ratio, SMA proximity, display style (most recent/historical) and more.
SMA Overlay : Optionally plot configurable SMA for context with proximity checks.
Support/Resistance Lines : Detect and visualize dynamic S/R based on recent swing highs/lows, with customizable lookback, style, color, and tolerance.
Trade Managemen t: Automated lines and labels for entry, stop loss, and up to three profit targets (ATR or risk multiples). Choose display mode and extend historical trades.
Visual Alerts : Color-coded bar highlights, up/down arrow label overlays, customizable colors for bullish/bearish power bars.
Use Cases
Rapidly spot and respond to strong market moves, often signaling trend initiation or continuation.
Integrate with multi-timeframe setups, momentum strategies, and discretionary trading.
Set up actionable alerts when a power bar triggers in real time.
Inputs
ATR length and multiplier
Wick ratio and SMA proximity
Support/resistance lookback, tolerance, style, color
Trade management toggle and TP calculation modes
Historical/max recent bars/trades limit controls
Alerts
Alert conditions for bullish, bearish, and any power bar event, supporting automated trading workflows.
HTF Ranges - AWR/AMR/AYR [bilal]📊 Overview
Professional higher timeframe range indicator for swing and position traders. Calculate Average Weekly Range (AWR), Average Monthly Range (AMR), and Average Yearly Range (AYR) with precision projection levels.
✨ Key Features
📅 Three Timeframe Modes
AWR (Average Weekly Range): Weekly swing targets - Default 4 weeks
AMR (Average Monthly Range): Monthly position targets - Default 6 months
AYR (Average Yearly Range): Yearly extremes - Default 9 years
🎯 Dual Anchor Options
Period Open: Week/Month/Year opening price
RTH Open: First RTH session (09:30 NY) of the period
📐 Projection Levels
100% Range Levels: Upper and lower targets from anchor
Fractional Levels: 33% and 66% zones for partial targets
Custom Mirrored Levels: Set any percentage (0-200%) with automatic mirroring
Example: 25% shows both 25% and 75%
Example: 150% shows both 150% and -50%
📊 Information Table
Active range type (AWR/AMR/AYR)
Average range value for selected period
Current period range and percentage used
Distance remaining to targets (up/down)
Color-coded progress (green/orange/red)
🎨 Fully Customizable
Orange theme by default (differentiates from daily indicators)
Line colors, styles (solid/dashed/dotted), and widths
Toggle labels on/off
Adjustable lookback periods for each timeframe
Independent settings for each range type
⚡ Smart Features
Lines start at actual period open (not fixed lookback)
Automatically tracks current period high/low
Works on any chart timeframe
Real-time range tracking
Alert conditions when targets reached or exceeded
🎯 Use Cases
AWR (Weekly Ranges):
Swing trade targets (3-7 day holds)
Weekly support/resistance zones
Identify weekly trend vs rotation
Compare daily moves to weekly context
AMR (Monthly Ranges):
Position trade targets (2-4 week holds)
Monthly breakout levels
Institutional-level zones
Earnings play targets
AYR (Yearly Ranges):
Major reversal zones
Long-term support/resistance
Identify macro trend strength
Annual high/low projections
💡 Trading Strategies
AWR Strategy (Swing Trading):
Week opens near AWR lower level = potential long setup
Target AWR 66% and 100% levels
Week hits AWR upper in first 2 days = watch for reversal
Use fractional levels as scale-in/scale-out points
AMR Strategy (Position Trading):
Month opens near AMR extremes = fade setup
Month breaks AMR in week 1 = expansion (trend) month
Target opposite AMR extreme for swing positions
Use 33%/66% for partial profit taking
AYR Strategy (Long-term Context):
Price near AYR extremes = major reversal zones
Breaking AYR levels = historic moves (rare)
Use for macro trend confirmation
Great for yearly forecasting and planning
📊 Range Interpretation
<33% Range Used: Early in period, room for expansion
33-66% Range Used: Normal progression
66-100% Range Used: Extended, approaching extremes
>100% Range Used: Expansion period - trending or high volatility
⚙️ Settings Guide
Lookback Periods:
AWR: 4 weeks (standard) - adjust to 8-12 for smoother average
AMR: 6 months (standard) - seasonal patterns
AYR: 9 years (standard) - captures full cycles
Anchor Type:
Period Open: Use for clean week/month/year open reference
RTH Open: Use if you only trade day session, ignores overnight gaps
Custom Levels:
25% = quartile targets
75% = three-quarter targets
80% = "danger zone" for reversals
111% = extended breakout target
🔄 Combine with ADR Indicator
Run both indicators together for complete multi-timeframe analysis:
ADR for intraday precision
AWR/AMR/AYR for swing/position context
See if today's ADR move is significant in weekly/monthly context
Multi-timeframe confluence = highest probability setups
💼 Ideal For
Swing Traders: Use AWR for 3-10 day holds
Position Traders: Use AMR for 2-8 week holds
Long-term Investors: Use AYR for macro context
Index Futures Traders: ES, NQ, YM, RTY
Multi-timeframe Analysis: Combine with daily ADR

Advanced ICT ADR Projections [bilal]📊 Overview
Professional ADR indicator designed specifically for index futures traders. Calculate and visualize Average Daily Range with multiple session options, fractional levels, and higher timeframe context.
✨ Key Features
🎯 Multiple Session Types
Full Day: Standard calendar day calculation
Midnight: Anchored to 00:00 NY time open
RTH (Regular Trading Hours): 09:30-16:00 NY session
Custom: Define your own session hours and anchor point
📐 Projection Levels
100% ADR Levels: Upper and lower range targets from anchor
Fractional Levels: 33% and 66% zones for partial targets
Custom Mirrored Levels: Set any percentage (0-200%) with automatic mirroring
Example: 25% shows both 25% and 75%
Example: 111% shows both 111% and -11%
📅 Higher Timeframe Context (Optional)
AWR: Average Weekly Range overlay
AMR: Average Monthly Range overlay
AYR: Average Yearly Range overlay
All HTF ranges use same anchor as daily session
📊 Information Table
Current session type and anchor time
ADR value for selected period
Current range and percentage used
Distance remaining to ADR targets (up/down)
Color-coded range percentage (green/orange/red)
🎨 Fully Customizable
Line colors, styles (solid/dashed/dotted), and widths
Toggle labels on/off
Adjustable ADR lookback period (1-100 days)
All HTF periods customizable
⚡ Smart Features
Lines start at actual session open (not fixed lookback)
Works on any timeframe
Real-time range tracking
Alert conditions when ADR reached or exceeded
🎯 Use Cases
For Day Traders:
Set profit targets at ADR extremes
Identify range expansion vs rotation days
Know when you've used 75%+ of daily range (possible reversal)
Compare RTH vs full day ranges
For Swing Traders:
Use AWR/AMR for weekly/monthly targets
Understand if today's move is significant in weekly context
Multi-timeframe confluence
Risk Management:
Size positions based on % of ADR remaining
Avoid trading when ADR exhausted (>100%)
Better stop placement using fractional levels
💡 Trading Tips
<50% ADR used = Room to run (continuation trades)
50-75% ADR used = Getting extended (scale out)
75-100% ADR used = Near extremes (reversal setups)
>100% ADR = Expansion day (trend day or volatility spike)
Use fractional levels (33%, 66%) as:
Partial profit targets
Re-entry zones on pullbacks
Confluence with other support/resistance
Compare RTH vs Full Day ADR to see if overnight or day session drives volatility.
⚙️ Settings Guide
ADR Period: 5 days is standard, adjust for different market regimes
Session Types:
Use Midnight for crypto or 24hr markets
Use RTH for pure day session analysis
Use Custom for specific session times (London, Asia, etc.)
Custom Levels:
Set 25% for quartile levels
Set 111% for extended targets beyond ADR
Experiment with 50%, 75%, 80% for your strategy
Perfect for ES, NQ, YM, RTY futures traders who need precise intraday range analysis with higher timeframe context!

Aibuyzone Vector Strategy - Floating DashboardVector Strategy – Floating Dashboard
The Vector Strategy is a visual trading-analysis tool designed to highlight strong directional candles that may represent impulsive moves in the market. It combines candle-structure analysis, volatility expansion, volume conditions, and trend filters into a single clear visual display.
Core Logic
Identifies candles where the body makes up a significant portion of the full bar range, suggesting strong directional intent.
Uses an ATR (Average True Range) expansion filter to confirm that the current candle’s range is larger than normal volatility.
Optionally applies a wick-imbalance requirement to favor bars showing a clear directional bias.
Can include a volume spike filter, marking candles where volume exceeds a moving average multiple.
Trend and Momentum Filters
Local trend: Defined by a fast and slow EMA pair to show short-term bias.
Higher-timeframe trend: Optionally aligns with an EMA from a higher timeframe to confirm broader momentum.
Momentum: RSI filter avoids generating signals in heavily overbought or oversold conditions.
Fair Value Gap (FVG) Option
When enabled, the script checks for a simple three-bar fair-value-gap structure in the direction of the potential signal, acting as an additional confirmation filter.
Signals and Visuals
Plots fast and slow EMAs to visualize the underlying trend.
Displays up/down shapes when qualifying vector-candle conditions occur.
Optional labels show “Vector Long” or “Vector Short” at the candle where conditions align.
Includes alert conditions for both long and short setups.
Floating Dashboard
A compact floating panel summarizes the most recent signal and market context:
Current signal state (Long / Short / Neutral)
Trend bias (Bullish / Bearish / Flat)
RSI reading
Body-to-range percentage
Volume-spike confirmation
Practical Use
This tool can assist traders in identifying strong impulsive candles aligned with a trend filter.
It is meant to complement a complete trading strategy, not to be used in isolation.
Traders may adjust thresholds such as ATR multiple, body-percentage, or RSI range based on the instrument’s volatility and personal risk tolerance.
Important Notice
This script is provided for educational and analytical purposes only.
It does not provide financial advice, recommendations, or guaranteed results.
Market conditions vary, and past performance does not ensure future outcomes.
Always test and validate any configuration in a simulated environment before live trading.

Gann Astronomical Turning PointsThis is a comprehensive Pine Script that implements W.D. Gann's astronomical theories to identify potential market turning points. Here's a detailed breakdown of the script:
Overview
The script identifies and displays astronomical events (sun angles, moon phases, and Mercury retrogrades) that Gann theorists believe correlate with market turning points. It also analyzes historical price performance following these events to provide statistical significance.
Key Components
1. Input Parameters
Date Range: Users can set the analysis period (start and end dates)
Display Options: Toggle visibility of different astronomical events and tables
Analysis Settings: Configure the lookback period for price change analysis (1-20 days)
2. Astronomical Calculations
The script includes several functions to calculate celestial positions:
getDaysSinceEpoch(t): Calculates days since January 1, 2000 (reference point)
getSunLongitude(t): Computes the Sun's position in the ecliptic (0-360°)
getMoonPhase(t): Determines the Moon's phase angle relative to the Sun
getMercuryLongitude(t): Calculates Mercury's position in the ecliptic
3. Gann Critical Angles (Sun Events)
The script identifies when the Sun reaches four critical angles that Gann considered significant:
0° Aries (Spring Equinox)
90° Cancer (Summer Solstice)
180° Libra (Fall Equinox)
270° Capricorn (Winter Solstice)
These are detected by tracking when the Sun's longitude crosses these specific angles.
4. Moon Phases
Four key moon phases are identified:
New Moon: Moon passes between Earth and Sun
First Quarter: Moon is 90° east of Sun
Full Moon: Moon is opposite the Sun
Last Quarter: Moon is 270° east of Sun
5. Mercury Retrograde Periods
The script detects when Mercury appears to move backward in its orbit:
Identifies start and end dates of retrograde motion
Displays these periods as highlighted zones on the chart
6. Price Change Analysis
For each astronomical event, the script:
Calculates the percentage price change over a user-defined lookback period
Categorizes changes as positive or negative
Stores this data for statistical analysis
7. Statistical Significance
The script calculates several metrics for each event type:
Average Price Change: Mean percentage change following events
Up/Down Ratio: Number of positive vs. negative changes
Accuracy Percentage: How often the dominant direction occurred
8. Visual Elements
The script includes multiple display components:
Event Labels
Sun Angles: Orange sun symbols displayed above price bars
Moon Phases: Moon phase emojis displayed below price bars
Mercury Retrograde: Red boxes highlighting the retrograde periods
Information Tables
Events Table: Shows upcoming and recent astronomical events
Significance Analysis Table: Displays statistical performance of each event type
Forecast Section: Identifies the next upcoming event and predicted direction
9. Forecasting Functionality
The script predicts market direction for the next astronomical event based on:
Historical average price change for that event type
Statistical accuracy of previous similar events
Color-coded forecast (green for bullish, red for bearish)
This script offers an interesting implementation of Gann's astronomical theories, but should be used as part of a broader analysis rather than as a standalone trading system.
Disclaimer: This indicator is for educational purposes only. Past performance does not guarantee future results. Always conduct your own research and risk assessment before trading.

Orb DivergenceOrb Divergence is a market reversal indicator that visually highlights moments when price momentum is ready to shift direction.
It detects hidden energy imbalances within price movements and identifies potential trend turning points formed by these accumulations.
The indicator displays colored orbs and clear “UP / DOWN” signals to mark upcoming reversals in a simple and intuitive way.
Rather than focusing on short-term reactions, it emphasizes key zones where market momentum may truly change.
Designed as a visual compass, Orb Divergence helps you spot the moments when the market takes a breath — and prepares to turn.
For a deeper and more data-driven approach to market structure and reversal dynamics, you may also want to explore Teometric Demand Model V3;

Market Structure Volume ProfileThis indicator visualizes volume profiles that are dynamically anchored to market structure events, rather than fixed time intervals. It builds these profiles using high-resolution intra-bar data to provide a precise view of where value is established during critical market phases.
Key Features:
Event-Based Profile Anchoring: The indicator starts a new profile based on one of three user-selected events ('Profile Anchor'):
Swing: A new profile begins when the 'impulse baseline' (derived from intra-bar delta) changes. This baseline adjusts when a new price pivot is confirmed: When a price high forms, the baseline moves to the lower of its previous level or the peak delta (max of delta O/C) at the pivot. When a price low forms, it moves to the higher of its previous level or the trough delta (min of delta O/C) at the pivot.
Structure: A new profile begins immediately on the bar that confirms a market structure break (e.g., a new HH or LL, based on a sequence of price pivots).
Delta: A new profile begins immediately on the bar that confirms a break in the cumulative delta's market structure (e.g., a new HH or LL in the delta). Both 'Swing' and 'Delta' anchors are derived from the same continuous (non-resetting) Cumulative Volume Profile Delta (CVPD), which is built from the intra-bar statistical analysis.
Statistical Profile Engine: For each bar in the anchored period, the indicator builds a volume profile on a lower 'Intra-Bar Timeframe'. Instead of simple tick counting, it uses advanced statistical models:
Allocation ('Allot model'): 'PDF' (Probability Density Function) distributes volume proportionally across the bar's range based on an assumed statistical model (e.g., T4-Skew). 'Classic' assigns all volume to the close.
Buy/Sell Split ('Volume Estimator'): 'Dynamic' applies a model that analyzes candle wicks and recent trend to estimate buy/sell pressure. 'Classic' classifies all volume based on the candle color.
Visualization & Lag: The indicator plots the final profile (as a polygon) and the developing statistical lines (POC, VA, VWAP, StdDev).
Note on Lag: All anchor events require Pivot Right Bars for confirmation.
In 'Structure' and 'Delta' mode, the developing lines (POC, VA, etc.) are plotted using a non-repainting method (showing the value from pivRi bars ago).
In 'Swing' mode, the profile is plotted retroactively, starting from the bar where the pivot occurred. The developing lines are also plotted with this full pivRi lag to align with the past data.
Flexible Display Modes: The finalized profile can be displayed in three ways: 'Up/Down' (buy vs. sell), 'Total' (combined volume), and 'Delta' (net difference).
Dynamic Row Sizing: Includes an option ('Rows per Percent') to automatically adjust the number of profile rows (buckets) based on the profile's price range.
Integrated Alerts: Includes 13 alerts that trigger for:
A new profile reset ('Profile was resetted').
Price crossing any of the 6 developing levels (POC, VA High/Low, VWAP, StdDev High/Low).
Alert Lag Assumption: In 'Swing' mode, alerts are delayed to match the retroactively plotted lines. In 'Structure' and 'Delta' modes, alerts fire in real-time based on the current price crossing the current (repainting) value of the metric, which may differ from the non-repainting plotted line.
Caution: Real-Time Data Behavior (Intra-Bar Repainting) This indicator uses high-resolution intra-bar data. As a result, the values on the current, unclosed bar (the real-time bar) will update dynamically as new intra-bar data arrives. This includes the values used for real-time alerts in 'Structure' and 'Delta' modes.
DISCLAIMER
For Informational/Educational Use Only: This indicator is provided for informational and educational purposes only. It does not constitute financial, investment, or trading advice, nor is it a recommendation to buy or sell any asset.
Use at Your Own Risk: All trading decisions you make based on the information or signals generated by this indicator are made solely at your own risk.
No Guarantee of Performance: Past performance is not an indicator of future results. The author makes no guarantee regarding the accuracy of the signals or future profitability.
No Liability: The author shall not be held liable for any financial losses or damages incurred directly or indirectly from the use of this indicator.
Signals Are Not Recommendations: The alerts and visual signals (e.g., crossovers) generated by this tool are not direct recommendations to buy or sell. They are technical observations for your own analysis and consideration.

Periodic Volume ProfileThis indicator visualizes volume profiles that are dynamically anchored to market structure events, rather than fixed time intervals. It builds these profiles using high-resolution intra-bar data to provide a precise view of where value is established during critical market phases.
Key Features:
Event-Based Profile Anchoring: The indicator starts a new profile based on one of three user-selected events ('Profile Anchor'):
Swing: A new profile begins when the 'impulse baseline' (derived from delta) changes. This baseline adjusts when a new price pivot is confirmed: When a price high forms, the baseline moves to the lower of its previous level or the peak delta (max of delta O/C) at the pivot. When a price low forms, it moves to the higher of its previous level or the trough delta (min of delta O/C).
Structure: A new profile begins immediately on the bar that confirms a market structure break (e.g., a new HH or LL, based on a sequence of price pivots).
Delta: A new profile begins immediately on the bar that confirms a break in the cumulative delta's market structure (e.g., a new HH or LL in the delta).
Statistical Profile Engine: For each bar in the anchored period, the indicator builds a volume profile on a lower 'Intra-Bar Timeframe'. It uses:
Statistical Models ('Allot model'): Distributes volume across price levels using 'PDF' (Probability Density Function) or 'Classic' (close) methods.
Buy/Sell Classifiers ('Volume Estimator'): Splits volume using a 'Dynamic' (trend/wick-based) or 'Classic' (candle color) model.
Note on Anchor Lag: The different anchor types have different delays. 'Structure' and 'Delta' profiles begin in real-time on the confirmation bar. The 'Swing' profile calculation is plotted retroactively to the pivot's origin, as the pivot is only confirmed Pivot Right Bars after it occurs.
Flexible Visualization Modes: The finalized profile (plotted at the end of each period) can be displayed in three ways: 'Up/Down' (buy vs. sell), 'Total' (combined volume), and 'Delta' (net difference).
Developing Real-Time Metrics: The indicator plots the developing Point of Control (POC), Value Area (VA), VWAP, and Standard Deviation bands in real-time as the new profile forms.
Dynamic Row Sizing: Includes an option ('Rows per Percent') to automatically adjust the number of profile rows (buckets) based on the profile's price range, maintaining a consistent visual density.
Integrated Alerts: Includes 13 alerts that trigger for:
A new profile reset ('Profile was resetted').
Price crossing any of the 6 developing levels (POC, VA High/Low, VWAP, StdDev High/Low).
Caution: Real-Time Data Behavior (Intra-Bar Repainting) This indicator uses high-resolution intra-bar data. As a result, the values on the current, unclosed bar (the real-time bar) will update dynamically as new intra-bar data arrives. This behavior is normal and necessary for this type of analysis. Signals should only be considered final after the main chart bar has closed.
DISCLAIMER
For Informational/Educational Use Only: This indicator is provided for informational and educational purposes only. It does not constitute financial, investment, or trading advice, nor is it a recommendation to buy or sell any asset.
Use at Your Own Risk: All trading decisions you make based on the information or signals generated by this indicator are made solely at your own risk.
No Guarantee of Performance: Past performance is not an indicator of future results. The author makes no guarantee regarding the accuracy of the signals or future profitability.
No Liability: The author shall not be held liable for any financial losses or damages incurred directly or indirectly from the use of this indicator.
Signals Are Not Recommendations: The alerts and visual signals (e.g., crossovers) generated by this tool are not direct recommendations to buy or sell. They are technical observations for your own analysis and consideration.

AutoPivot Levels with Alerts [ChartWhizzperer] – Dynamic EditionAuto-Pivot Levels 4 methods with alerts – Dynamic Edition
Now with
- Live Mode
- 4 Pivot Methods
- 7 Session Types (5m, 15m, 30m, Hourly, Daily, Weekly, Monthly)
- PineConnector-Ready Alerts!
Free, Open Source, Pine Script v6-compliant.
NEW: Live Mode (Ultra-Dynamic, Repainting) – Switchable in UI!
Instantly switch between Classic (session-based, repaint-free) and Live (rolling window, real-time, repainting) using the simple checkbox in the settings!
Live Mode recalculates all pivots on every tick/bar, using the current high/low/close for the chosen session (5m, 15m, 30m, hourly, daily, weekly, monthly).
Perfect for:
- Scalping and high-frequency trading
- Real-time bot/automation setups (PineConnector-ready)
- Fast-moving or breakout markets
Classic Mode: For traditional, stable levels based on confirmed session data – ideal for backtesting and trading history.
Four Calculation Methods (Choose What Fits YOU)
1. Classic
Standard pivot calculation.
Based on previous session’s High, Low, Close.
Simple, proven, and suitable for any asset.
2. Fibonacci
Projects levels using Fibonacci ratios of the prior session’s range.
Great for traders who want to align pivots with fib retracements and extensions.
3. Camarilla
Uses unique multipliers for support/resistance, focusing on mean reversion and volatility.
Popular among futures and forex day traders.
4. Woodie
Puts extra weight on previous Close for more responsive pivots.
Often used in trending or choppy conditions.
Switch methods anytime in the UI – the script recalculates instantly and keeps your chart clean!
Level-Specific Alerts – PineConnector Ready!
Dedicated alert for EVERY level and direction (Up/Down):
Pivot (P), R1, R2, R3, S1, S2, S3
No configuration hassle:
All alerts are pre-defined in the TradingView Alert Panel and work across all session types (5m → monthly).
Machine-readable message format:
PIVOT=R1 DIR=UP SYMBOL={{ticker}} PRICE={{close}}
Direct plug-and-play with PineConnector, webhooks, Discord, Telegram, bots, and other automation tools.
Never miss a breakout, reversal, or key support/resistance touch!
Powerful Customization & Performance
- Session selection: 5m, 15m, 30m, Hourly, Daily, Weekly, Monthly (choose what suits your trading style).
- Show/hide any level (Pivot, R1–R3, S1–S3) for minimal chart clutter.
- Color selection for each level to match your theme or highlight key pivots.
- Auto-cleanup: Old lines and labels are cleared on every recalculation or session change for maximum performance and visual clarity.
- Zero runtime errors: Strict Pine Script v6 practices for stability.
How To Use – Quick Start
1) Add the indicator to your TradingView chart.
2) Pick your calculation method (Classic, Fibonacci, Camarilla, Woodie).
3) Set session type (5m, 15m, 30m, Hourly, Daily, Weekly, Monthly).
4) Switch between Classic and Live Mode with a single click in settings.
5) Customize your levels (on/off, colors).
6) Open the Alert Panel, select any pre-configured alert (e.g. "R2 Cross Down"), and go live!
7) Connect with PineConnector or any webhook system instantly using the pre-formatted alert messages.
Who Is It For?
- Active scalpers & bot traders: Live Mode + PineConnector-ready alerts = instant, automated reactions.
- Swing and position traders: Use Classic Mode for stable, repaint-free levels.
- Strategy developers: Seamless integration into automated and manual trading workflows.
License & Community
Open Source, Non-Commercial:
Free for personal & educational use under CC BY-NC-SA 4.0.
Feedback, bug reports & ideas:
Drop a comment, or contact me for feature requests.
Trade smart. Trade dynamic. Unlock the true power of pivots – with ChartWhizzperer!

VolumeAnlaysis### Volume Analysis (VA) Indicator
**Overview**
The Volume Analysis (VA) indicator is a dynamic overlay tool designed for traders seeking to identify high-volume breakouts, retests, and multi-timeframe volume-driven price cycles. By combining volume spikes with price action and support/resistance boxes, it highlights potential trend continuations, reversals, and cycle shifts. Ideal for intraday and swing trading on stocks, forex, or crypto, it uses a Fibonacci-inspired 1.618 multiplier to detect significant volume surges, then maps them to visual boxes and key levels for actionable insights.
This indicator draws from volume profile concepts but focuses on **breakout confirmation** and **cycle momentum**, helping you spot when "smart money" volume aligns with price extremes. It's particularly useful in volatile markets where volume precedes price moves.
**How It Works**
1. **Volume Break Detection**:
- Identifies a "Volume Break" when the current bar's volume exceeds 1.618x the highest volume from the prior 5 bars. This signals unusual activity, often preceding breakouts.
- A "Volume Retest" triggers exactly 3 bars after a break if volume has been falling steadily over those 3 bars—indicating a pullback for re-accumulation/distribution.
2. **Visual Annotations**:
- **Labels**: Green/red/yellow labels mark Volume Breaks and Retests, positioned above/below the bar based on candle direction for clarity.
- **Demand/Supply Boxes**:
- Blue semi-transparent boxes form around Retest bars, extending rightward to act as dynamic support/resistance.
- Green (bullish) or red (bearish) boxes draw from Volume Breaks, based on the original candle's open/close, highlighting potential zones for continuation.
- Limited to 5 boxes max to avoid chart clutter; older boxes fade as new ones form.
3. **Box Interaction Signals**:
- When price enters a box:
- **Reversal Hints**: Maroon (bearish rejection) or lime (bullish rejection) labels on closes against the trend with opening price momentum.
- **Breakout Arrows**: Up/down arrows on crossovers/crossunders of box tops/bottoms from Retest boxes.
- Scans all active boxes for interactions, prioritizing recent volume events.
4. **Multi-Timeframe Volume Cycles**:
- Aggregates the "Volume Break Max" level (a proxy for key price extremes tied to volume spikes) across timeframes: 1min, 5min, 10min, 30min, and 65min (using `request.security`).
- Computes **MaxVolBreak** (highest extreme) and **MinVolBreak** (lowest extreme) for trend-following levels.
- Tracks **Percent Volume Greater/Less Than Close**: Sums volumes from TFs where price is below/above these levels, creating a momentum ratio.
- **CrossClose**: Plots the prior close where this ratio crosses (gray line), signaling cycle shifts—bullish below MinVolBreak, bearish above MaxVolBreak.
- **Fills**: Red fill above CrossClose/MaxVolBreak (bearish cycle); green below CrossClose/MinVolBreak (bullish cycle).
5. **Plots**:
- Black lines for MaxVolBreak (⏫) and MinVolBreak (⏬).
- Gray 🔄 for CrossClose.
- Colors dynamically adjust (green/red) based on close relative to levels.
**Key Features**
- **Trend vs. Reversal Modes**: Toggle alerts for trend-following breaks (crosses of Max/MinVolBreak) or reversal signals (crosses of CrossClose).
- **Multi-TF Fusion**: Optionally include the chart's native timeframe in Max/Min calculations for finer tuning.
- **Box Management**: Auto-prunes to 5 boxes; focuses on retest/break alignments for "inside bar" logic.
- **Momentum Filters**: Uses rising/falling opens and crossovers for label precision, reducing noise.
- **Customizable**: Simple inputs for alert visibility and timeframe inclusion.
**Settings**
| Input | Default | Description |
|-------|---------|-------------|
| Show Volume Reversal Breaks | False | Enables alerts/labels for CrossClose crosses (cycle reversals). |
| Show Trend Following Breaks | True | Enables alerts for Max/MinVolBreak crosses (trend signals). |
| Use Current Time | False | Includes chart's native TF in multi-TF Max/Min calculations. |
**Alerts**
- **Reversal Alerts** (if enabled): "Volume Reverse Bullish/Bearish Break of " on close crosses of CrossClose.
- **Trend Alerts** (if enabled): "Trend Volume Bullish/Bearish Signal" on close crosses of Max/MinVolBreak; plus notes if prior low/high aligns with levels.
- All alerts include ticker and level value for easy scanning. Use `alert.freq_once_per_bar` to avoid spam.
**Trading Ideas**
- **Bullish Entry**: Green box formation + price holding MinVolBreak + upward arrow on retest box. Target next resistance.
- **Bearish Entry**: Red box + close above MaxVolBreak + red fill activation. Stop below recent low.
- **Cycle Trading**: Watch CrossClose crosses for regime shifts—fade extremes in overextended cycles.
- **Best Timeframes**: 5-30min for intraday; combine with daily for swings. Works best on liquid assets with reliable volume data.
**Limitations & Notes**
- Relies on accurate volume data (e.g., stocks/forex); less effective on low-volume or synthetic instruments.
- Boxes extend rightward but don't auto-delete—monitor for clutter on long histories (max_bars_back=500).
- Some logic (e.g., exact 3-bar retest) is rigid; backtest for your market.
- Open-source under MPL 2.0—fork and tweak as needed!
For questions or enhancements, drop a comment below. Happy trading! 🚀

EMA Slope Trend Change (Compact Signals)This indicator visualizes trend direction using the slope of an Exponential Moving Average (EMA).
It changes color as the EMA slope turns positive or negative, and displays compact up/down markers to highlight slope reversals.
Features:
Dynamic color change based on EMA slope
Compact visual signals at slope reversals
Adjustable EMA length and signal display
Minimalist design for clean chart use
This tool is intended for trend visualization and educational analysis only.
It does not provide buy/sell recommendations or guarantee any performance outcomes.

Pattern DetectorPattern Detector
Identifies and summarizes common chart patterns on any symbol/timeframe. Shows a compact table of the most recent confirmed patterns (up to 6), optional candle coloring that matches table row colors, and optional targets for context. Designed for analysis support only.
What it detects
Triangles and wedges, flags and pennants, head & shoulders (and inverse), rectangles, channels, broadening formations, double/triple tops & bottoms, cup & handle (and inverse), rounding tops/bottoms, diamonds, bump & run, island reversals, staircase patterns, V patterns, gaps (up/down), pipe/spike patterns, harmonic ABCD, Elliott (simplified), three drives, Quasimodo, dead cat bounce, tower top/bottom, shakeout, and Wolfe waves.
Inputs
Lookback Mode: Auto or Manual (Manual Lookback bars)
Min Confidence to Confirm: threshold for confirmation
Display: Show Pattern Table, Show Pattern Numbers, Color Pattern Candles
Style: table row colors; bullish/bearish direction colors
Notes:
Candle coloring uses the table’s row colors and requires Show Pattern Table to be enabled.
Targets are approximate and for reference only.
Alerts
Pattern Confirmed
Pattern Target Reached
Important
Educational/information tool only; not a signal generator and not financial advice.
No performance guarantees. Use with other analysis and risk management.
Calculations update in real time; confirmations happen on closed bars. Detected patterns can change intrabar; use closed‑bar alerts for greater reliability.
Results may vary by symbol, timeframe, liquidity, and volatility.

Trading Toolkit - Comprehensive AnalysisTrading Toolkit – Comprehensive Analysis
A unified trading analysis toolkit with four sections:
📊 Company Info
Fundamentals, market cap, sector, and earnings countdown.
📅 Performance
Date‑range analysis with key metrics.
🎯 Market Sentiment
CNN‑style Fear & Greed Index (7 components) + 150‑SMA positioning.
🛡️ Risk Levels
ATR/MAD‑based stop‑loss and take‑profit calculations.
Key Features
CNN‑style Fear & Greed approximation using:
Momentum: S&P 500 vs 125‑DMA
Price Strength: NYSE 52‑week highs vs lows
Market Breadth: McClellan Volume Summation (Up/Down volume)
Put/Call Ratio: 5‑day average (inverted)
Volatility: VIX vs 50‑DMA (inverted)
Safe‑Haven Demand: 20‑day SPY–IEF return spread
Junk‑Bond Demand: HY vs IG credit spread (inverted)
Normalization: z‑score → percentile (0–100) with ±3 clipping.
CNN‑aligned thresholds:
Extreme Fear: 0–24 | Fear: 25–44 | Neutral: 45–54 | Greed: 55–74 | Extreme Greed: 75+.
Risk tools: ATR & MAD volatility measures with configurable multipliers.
Flexible layout: vertical or side‑by‑side columns.
Data Sources
S&P 500: CBOE:SPX or AMEX:SPY
NYSE: INDEX:HIGN, INDEX:LOWN, USI:UVOL, USI:DVOL
Options: USI:PCC (Total PCR), fallback INDEX:CPCS (Equity PCR)
Volatility: CBOE:VIX
Treasuries: NASDAQ:IEF
Credit Spreads: FRED:BAMLH0A0HYM2, FRED:BAMLC0A0CM
Risk Management
ATR risk bands: 🟢 ≤3%, 🟡 3–6%, ⚪ 6–10%, 🟠 10–15%, 🔴 >15%
MAD‑based stop‑loss and take‑profit calculations.
Author: Daniel Dahan
(AI Generated, Merged & enhanced version with CNN‑style Fear & Greed)

Ichimoku MultiTF WillyArt v1.0.0What this indicator does
Ichimoku WillyArt turns the Ichimoku lines into angle-based momentum across multiple timeframes (W, D, 4H, 1H, 30m, 5m).
For each TF it computes the slope (angle in degrees) of:
Tenkan-sen
Kijun-sen
Senkou Span A
Senkou Span B
Angles are normalized so they’re comparable across assets and scales. You get a table with the angle per line and a quick emoji direction (↑, →, ↓), optional plots of the chosen line, and ready-to-use alerts.
Why angle?
Slope-as-degrees is an intuitive proxy for momentum/impulse:
Positive angle → line rising (bullish impulse).
Negative angle → line falling (bearish impulse).
Near zero → flat/indecisive.
Two normalization modes
ATR (default): slope / ATR. Robust across instruments; less sensitive to price level.
%Price: slope / price. More sensitive; can highlight subtle turns on low-volatility symbols.
Inputs you’ll actually care about
Timeframes: W, D, 4H, 1H, 30m, 5m (all fetched MTF, independent of chart TF).
Ichimoku lengths: Tenkan (9), Kijun (26), Span B (52) — standard defaults.
Bars for slope (ΔN): How many bars back the slope is measured. Higher = smoother, slower.
Threshold (°) for “strong”: Angle magnitude that qualifies as strong ↑/↓.
What you’ll see
Matrix/Table (top-right): For each TF, the angle (°) of Tenkan, Kijun, Span A, Span B + an emoji:
↑ above threshold, ↓ below −threshold, → in between.
Optional plots: Toggle “Plot angles” to visualize the chosen series’ angle across TFs.
Alerts included (ready to pick in “Create Alert”)
Sustained state: e.g., “Kijun 4H: strong ↑ angle” triggers while angle > threshold.
Threshold cross (one-shot): e.g., “Kijun 1H: upward threshold cross” fires on crossing.
Consensus (multi-TF): “Kijun consensus ↑ (D/4H/1H/30m/5m)” when all selected TFs align up (and the symmetric down case).
Messages are constant strings (TradingView requirement), so they compile cleanly. If you want dynamic text (current angle, threshold value, etc.), enable your own alert() calls—this script structure supports adding them.
How to use it (workflow)
Add to chart. No need to switch chart TF; the script pulls W/D/4H/1H/30m/5m internally.
Pick normalization. Start with ATR. Switch to %Price if you want more sensitivity.
Set ΔN & threshold.
Intraday momentum: try ΔN = 3–5 and threshold ≈ 4–8°.
Swing/position: ΔN = 5–9 and threshold ≈ 3–6° (with ATR).
Scan the table. Look for alignment (multiple TFs with ↑ or ↓ on Kijun/Spans).
Kijun + Span A up together → trending push.
Span B up/down → cloud baseline tilting (trend quality).
Turn on alerts that match your style: reactive cross for entries, sustained for trend follow, consensus to filter noise.
Reading tips
Kijun angle: great “trend backbone.” Strong ↑ on several TFs = higher-probability pullback buys.
Span A vs. Span B:
Span A reacts faster (momentum).
Span B is slower (structure).
When both tilt the same way, the cloud is genuinely rotating.
Mixed signals? Use higher TFs (W/D/4H) as bias, lower TFs (1H/30m/5m) for timing.
Good to know (limits & best practices)
Angles measure rate of change, not overbought/oversold. Combine with price structure and risk rules.
Extremely low volatility or illiquid symbols can produce tiny angles—%Price mode may help.
ΔN and thresholds are contextual: adapt per market (crypto vs FX vs equities).
Want me to bundle a “pro template” of alert presets (intraday / swing) and a heatmap color scale for the table? Happy to ship v2. 🚀

CandleFlow — Adaptive-Colored Bollinger BandsEN — What it is
Classic Bollinger Bands with adaptive color. Bands turn green when the basis slope is rising and red when it is falling. Same BB math; only visuals adapt. Two-state only.
Features
• Works on any timeframe; built with daily crypto in mind
• Inputs: Length 20, Multiplier 2.0, MA Type (SMA/EMA/WMA), Slope Length, Up/Down thresholds, Band fill
• Alerts: Trend state turns Up / turns Down
Notes
• Invite-only access. Source code not provided.
• No profit guarantee; this is not financial advice.
KR — 요약
표준 볼린저 계산은 그대로, 기준선이 상승하면 초록/하락하면 빨강으로 자동 색상 전환. 일봉 크립토에 최적화. 입력값(기간 20, 배수 2.0, MA 타입, 기울기 길이, 상/하 임계값, 밴드 채우기), 알림(상승/하락 전환) 제공. 초대전용, 코드 비공개. 수익 보장 없음.
Trademark
Bollinger Bands® is a registered trademark of John Bollinger. Not affiliated or endorsed.
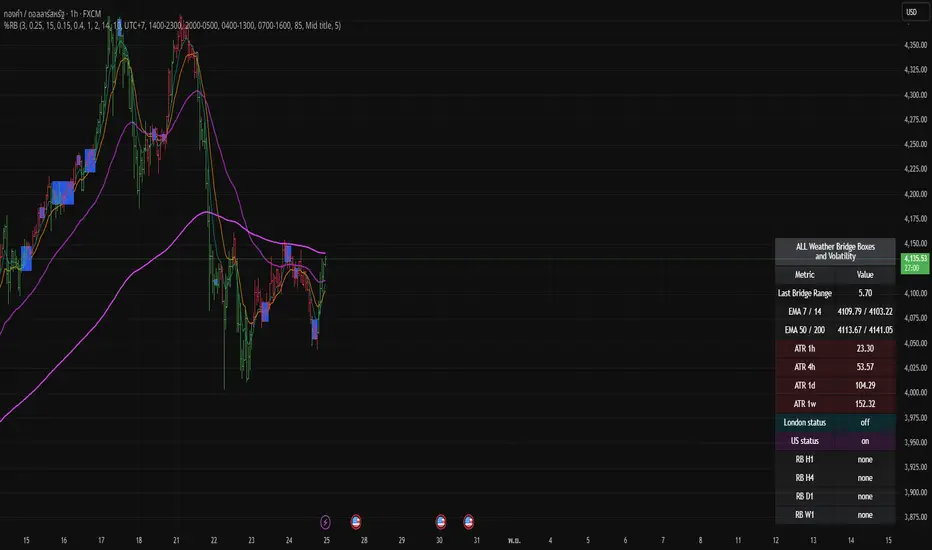
Bridge Boxes Bridge Boxes: detect compression when N consecutive B-bars occur (|close−open| ≤ ε%). Draw box and store latest top/bottom.
% Range Breakout (RB): compute mid = (top+bottom)/2 from last TOOLBAR box, freeze refClose = close , build up/down levels by TF-specific % (H1/H4/D1/W1). Trigger on cross; draw RB line/label; auto-clear next confirmed bar if no new break.
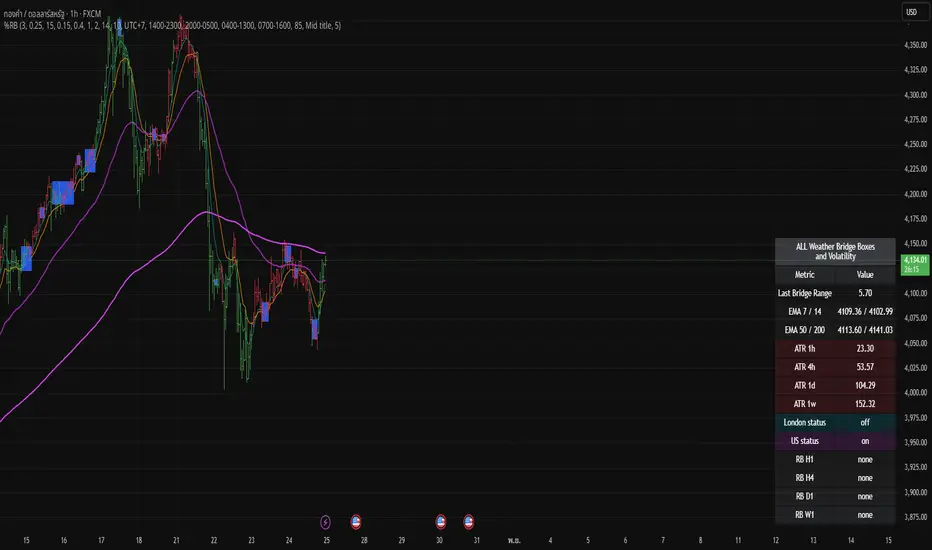
ZEN MTF Price ProjectionZEN MTF Price Projection
A lightweight, multi‑timeframe price projection that extends a ZigZag‑style path into the future. It chains six timeframes (1m → 5m → 15m → 1H → 4H → 1D) where each segment continues the previous one, creating a continuous forward path of arrows. The engine blends expected move and volatility to estimate the next leg for each TF. Calculations are proprietary and optimized for real‑time updates.
Caution
Treat the projection as a guide, not a guarantee. Avoid trading directly against higher‑TF segment direction.
Key features
MTF chained path: each TF continues the previous, producing a continuous forward “ZigZag‑style” projection.
Real‑time or timed updates: redraws every bar (Realtime) or every N minutes.
Visual arrows every N bars for readability; configurable segment length per TF.
Resource‑safe rendering with automatic cleanup.
Inputs (quick guide)
Bars per timeframe: number of bars each TF projects forward.
Arrow every N bars: density of arrows along each segment.
Update mode: Realtime or Every N minutes (default 1).
Colors: up/down palette for projected segments.
Alerts and workflow tips
Use Trading Panel alerts on color changes of the active segment (manual rule).
Combine with your execution playbook (e.g., candle confirmation, volume burst, or LTF pullback).
Best with liquid markets and regular sessions; widen SL on high‑volatility assets.
What this indicator is not
Not a crystal ball; it’s a probabilistic forward path based on proprietary MTF expectations and volatility scaling.
Not a replacement for risk management or market context.
Disclaimer
For educational purposes only. Past performance is not indicative of future results. Trade at your own risk.

QuickCheck RRS Reddit (Real Day Trading) scanner/indicator. Orginally posted by www.reddit.com
Please see original post here: www.reddit.com
Few things to note:
Very important: Indicators such as this, RVOL and RRS heavily rely on the datafeed that you have as part of your TradingView subscription. The speed of data updates coming through also matter. If you are using the free datafeed and don't pay for extra data sources in TradingView, the output might not be accurate. Discrepancies can be observed on volume (both intra-day and daily), VWAP, and sometimes the latest bid, ask open and close prices. You will see these discrepanices clearly when you compare it with other platforms that have better datafeeds (e.g. ToS).
The RRS and RVOL indicators are optimized for the M5 timeframe, please keep this indicator on your M5 charts. I have not tested this as much with other timeframes
TradingView does not support popping out a separate window and use it as a floating dashboard, like ToS does (it kinda does, but it is very cluttered). The best way right now is to use this indicator inside a chart as an overlay
Here is how it looks.
r/RealDayTrading - QuickCheck - Stock and SPY are in same direction
QuickCheck - Stock and SPY are in same direction
r/RealDayTrading - QuickCheck - Stock and SPY are in opposite direction
QuickCheck - Stock and SPY are in opposite direction
r/RealDayTrading - QuickCheck - Configuration
QuickCheck - Configuration
r/RealDayTrading - QuickCheck - This is how it appears on your chart. The position is configurable
QuickCheck - This is how it appears on your chart. The position is configurable
r/RealDayTrading - QuickCheck - Works in multiple charts at the same time in a grid
QuickCheck - Works in multiple charts at the same time in a grid
TradingView has a richer infrastructure for managing visual layouts, text alignment and string operations in general as compared to ToS, which is what made it possible to have a cleaner output. It also supports unicode, which allows using fancy icons for the up/down status. They're configurable, use whatever works for you!!
The same disclaimers apply from my previous post. Please use this at your own discretion having understood limitations of the datafeed inside TradingView and how this adapts to your strategy.
EDIT: Check top of this post for latest version of source code
Let me know if you have questions or feedback... and special thanks to u/SilverDollarDan for helping me test this indicator.

Unified Moving Average V5 (EN/UA)## Title
Unified Moving Average V5 — Practical Trend Tool (EN/UA UI)
## Short description
Practical trend tool that colors market direction, highlights potential turns with optional confirmation, and supports multi‑timeframe alignment. Includes live Max% tracking and a compact status panel. Bilingual EN/UA UI.
or quick bias assessment
- Potential turn signals with optional confirmation
- Multi‑timeframe (LTF/HTF) alignment tools
- Live Max% move tracking since the last turn
- A status panel showing state, confirmation, and key reference levels
## How to use (high level)
1) Pick your preferred MA family and length for the asset/timeframe you trade.
2) Enable trend coloring to see bias (up/down/neutral) instantly.
3) Turn on confirmation if you prefer additional validation on potential turns.
4) Use HTF as a directional filter and LTF for timing.
5) Watch the status panel for current state, confirmation state, and reference levels.
## Inputs (practical)
- Source: which price the MA reads (Close/Open/High/Low/HL2/HLC3/OHLC4)
- MA Type & Length: choose family (SMA/EMA/RMA/WMA/VWMA/HMA) and period (1–500)
- Display: line width, stepline, color‑by‑trend, colors, right‑side value label
- Alerts: potential turn alerts; price/MA cross alerts
- Profit / Max %: optional leverage multiplier and label colors
- Confirmation: adds additional validation on potential turns; debounce with Min bars between turns
- MTF: enable LTF/HTF, set timeframes, show lines, colors, entry labels, compact labels, append price
- Status panel: toggle table, choose corner, adjust offsets
## Signals & Alerts
- Potential turn (with optional confirmation)
- Price/MA cross
- LTF/HTF turn notifications## Overview
Unified MA V5 helps you read trend direction at a glance and align entries with your preferred timeframe stack. It offers:
- Trend coloring f
## Recommended presets (no strategy advice)
- Swing Trend Following
- MA: HMA or EMA; Length 100–200
- Confirmation: On; Min bars between turns: 2–4
- MTF: HTF = 4× current; LTF Off
- Display: Stepline On; Line width 3
- Alerts: Potential turn + Price/MA cross
- Intraday Momentum
- MA: EMA; Length 34–55
- Confirmation: On; Min bars between turns: 1–2
- MTF: HTF = 2–4×; LTF = 0.25–0.5×
- Display: Stepline On
- Alerts: Potential turn + Price/MA cross
- Scalping
- MA: WMA or HMA; Length 20–34
- Confirmation: Optional; Min bars between turns: 0–1
- MTF: LTF = 0.2–0.5×; HTF Optional
- Display: Stepline On; Consider disabling some labels to reduce clutter
- Alerts: Potential turn (short horizon)
- Mean‑Reversion Bias
- MA: RMA or SMA; Length 50–100
- Confirmation: On
- MTF: HTF = 2–4×; LTF Optional
- Display: Color‑by‑trend On
- Alerts: Price/MA cross emphasis
## Notes
- Labels can accumulate during volatile sessions; disable some if needed.
- Table offsets and placement options may vary by platform.
- This is a tool for visualization and alerts, not financial advice.
## Indicator direction
Trend-Following / Trend Change Detection with optional confirmation via MA retest.
USD Session 8FX - LDN & NY (TF-invariant, Live + Table)What it is
A USD strength/weakness meter for the London (08:00–08:45) or New York (15:30–16:00/16:15) session. It blends the movement of 8 markets—EURUSD, GBPUSD, AUDUSD, NZDUSD, USDCHF, USDCAD, USDJPY, XAUUSD—into one Score that is timeframe-invariant (it uses a 1-minute “boundary TF” under the hood so changing chart TF doesn’t change the math).
Core logic (simple)
During the chosen session window, it records each symbol’s start and live end prices, computes returns, optionally normalizes by ATR (volatility), applies your weights, and averages anti-USD (EUR/GBP/AUD/NZD/XAU) vs USD-base (CHF/CAD/JPY) groups.
The final Score is the normalized sum of weighted contributions:
Score > 0 → “USD Strong”
Score < 0 → “USD Weak”
At the session close it freezes (“Locked”) the results so you can review them later.
What you see
Main plot: the USD Score line (with a 0 baseline).
Optional lines: Anti-USD average vs USD-base average (post-normalization, pre-weights).
Session background shading (London silver, New York aqua).
Live table with:
Each symbol’s % change, its weight, and its contribution to the Score.
TOP badges for the two biggest drivers (by absolute contribution).
A Side column (only for the two TOPs) showing BUY/SELL aligned with the USD verdict (e.g., if USD Strong → SELL anti-USD pairs like EURUSD, BUY USD-base like USDCHF).
Verdict row with USD Strong/Weak, the Score value, the window text, and whether you’re LIVE / CLOSED / FROZEN.
Trade Gate panel:
Shows Verdict (USD Strong/Weak), Bias OK/weak (|Score| vs your threshold), Top-1/Top-2 VWAP checks, an overall GATE: OK/NO, and an Entry hint string (e.g., “SELL EURUSD, BUY USDCHF”) when conditions align.
VWAP “Trade Gate”
It confirms alignment between the USD bias and price vs VWAP for the top movers:
If USD Strong: anti-USD symbols should be below VWAP (short bias), USD-base symbols above VWAP (long bias).
If USD Weak: the opposite.
Gate = OK only if |Score| ≥ minAbsScore and at least one of the two TOP symbols is on the correct side of VWAP.
Tip: set vwapTF to an intraday value (“1”, “5”, “15”) for reliable VWAP on higher-TF charts.
Alerts
At session close: “USD Strong/Weak – session close”.
Live threshold: alerts when |Score| crosses your intraday threshold up/down.
Entry hint (Gate OK): triggers when the Gate flips from NO → OK inside the window.
If you create an alert of type “Any alert() function call”, you also get a dynamic message like:
ENTRY HINT • Hint: SELL EURUSD, BUY USDCHF
Key inputs you can tweak
Session: London vs New York; NY end time 16:00 or 16:15.
Timezone: default Europe/Tirane.
Boundary TF: default “1” (keeps the indicator TF-invariant).
minAbsScore: sensitivity threshold for “Bias OK”.
ATR normalization (len): stabilizes comparisons across different volatility regimes.
VWAP settings: toggle panel and set vwapTF.
How to use (playbook)
Choose the session (e.g., New York 15:30–16:15), keep Boundary TF = 1.
If you’re on a higher-TF chart, set vwapTF = "1" or "5".
Watch Score and Verdict; when |Score| ≥ minAbsScore, bias is meaningful.
Check Top-1/Top-2 and the Trade Gate:
If Gate = OK, use the Entry hint (e.g., “SELL EURUSD, BUY USDCHF”) as the aligned idea.
Use your own execution rules (e.g., structure, risk, stops) on the suggested symbols.
After close, review the Frozen table to validate behavior and refine thresholds/weights.
Notes & edge cases
If some markets are illiquid/holiday, a few returns may be na; the script handles that gracefully.
If ta.vwap is na on high TFs, the Gate will simply not confirm—set vwapTF intraday.
You can customize weights (e.g., reduce XAUUSD to -0.3 or similar) to suit your basket philosophy.
If you want, I can add toggles to show Side for all 8 symbols, or print a one-line summary (e.g., “USD Strong • Score 0.23 • Gate OK • SELL EURUSD, BUY USDCHF”) in the top-left of the pane.

AASI | QRAASI | QR — Active Address Sentiment Index
What it is
AASI | QR is a market activity gauge that compares on-chain participation (Active Addresses) with price momentum. It highlights regimes where network usage accelerates/decelerates relative to price and uses adaptive bands to flag expansions that may precede trend continuation or fade. Designed for BTC (and any symbol with an “Active Addresses” feed), it provides clear, visual context rather than trade calls.
How it works (principle, not code)
Active Address Momentum (core signal)
The script measures the rate of change (ROC) of Active Addresses and builds dynamic, volatility-scaled bands around zero. When address momentum pushes into progressively higher (or lower) bands, it reflects broadening (or narrowing) participation.
Price Momentum Overlay (context)
A price ROC runs alongside address momentum so you can visually compare participation vs. price. This helps distinguish healthy trend strength (price rising with rising participation) from potential exhaustion (diverging behavior).
Adaptive Bands (regimes)
Bands (±1×, ±2×, ±3× of the dynamic scale) expand/contract with recent variability in address momentum. The background tint optionally highlights strong expansions:
• Upper expansions → potential risk-on phases
• Lower expansions → potential risk-off phases
No fixed overbought/oversold thresholds are hard-coded; the bands adapt to the current regime, which helps keep the tool relevant across market phases.
Why this is useful (originality & value)
Most momentum overlays watch price alone. AASI adds a behavioral layer by tracking how many participants are active while price moves. This helps:
Separate euphoric spikes (price up, participation flat/falling) from broad advance (price up, participation rising).
Spot early cooling (participation momentum fades before price) and late accelerations (fresh participation kick).
Maintain clarity via adaptive scaling, so signals don’t go “permanently stretched” in strong cycles.
What you see on the chart
Zero Baseline with three up/down bands (±1, ±2, ±3).
Active Address ROC (soft line, main signal).
Price ROC (overlay line for context).
Optional background tint when price ROC reaches the upper or lower adaptive zones.
Clean presentation: the script is self-contained and readable without other overlays.
Inputs & customization
Bands & Trend: toggle visibility of ±1/±2/±3 bands.
Active Address & Price: toggle the address ROC and price ROC plots.
Color Mode: switch palettes to match your layout.
Lookbacks: the internal dynamic scaling is derived from recent variability of address momentum (kept simple for usability).
How to use it
Confluence: Look for price ROC and address ROC moving in the same direction and entering higher bands → strengthens the risk-on case.
Divergence: Price pushing higher while address ROC stalls or falls toward lower bands → participation not confirming; be cautious.
Regime shifts: When address ROC crosses the zero line and sustains inside ±1/±2 bands, it often marks a state change (cooling → heating or vice-versa).
Combine responsibly: Use with your risk framework (position sizing, stops). AASI is context, not an auto-trader.
Scope & data notes
Designed for BTC with a GLASSNODE:BTC_ACTIVEADDRESSES series.
Can be applied to other assets only if a comparable “Active Addresses” feed exists for that symbol. If no feed is present, use price ROC alone just for context (reduced informational value).
The script relies on close-form series provided on TradingView; no external links or delegation required to interpret its purpose.
Chart-publishing guidance
Publish with a clean chart showing only AASI to keep outputs identifiable.
If you add drawings, use them strictly to illustrate where participation confirmed or diverged from price.
Limitations
On-chain participation data can be noisy around events, holidays, or network anomalies.
Adaptive bands reflect recent variability; sudden structural changes may require time to re-scale.
Not a buy/sell system; it’s a diagnostic layer for regime awareness and confirmation.
Disclaimer
This tool is for research and educational purposes only and is not financial advice. Trading and investing involve risk, including loss of capital. Past performance does not predict or guarantee future results. Always validate settings on your timeframe and use proper risk management.
